前面我们介绍了如何通过 OpenTelemetry Collector 来收集 Kubernetes 集群的指标数据,接下来我们再来了解下如何收集集群的日志记录数据。
安装 Loki
首先我们需要部署 Loki 来收集日志数据,同样我们这里使用 Helm Chart 来快速部署,不过需要注意同样不需要部署任何日志采集器,因为我们将使用 OpenTelemetry Collector 来收集日志数据,然后再将其发送到 Loki 中。
1
2
| helm repo add grafana https://grafana.github.io/helm-chart
helm repo update
|
我们这里创建一个 loki-values.yaml 文件来配置 Loki Helm Chart:
1
2
3
4
5
6
7
8
9
10
11
12
13
14
15
16
17
18
19
20
21
22
23
24
25
26
27
28
29
30
31
|
loki:
commonConfig:
replication_factor: 1
auth_enabled: false
storage:
type: "filesystem"
singleBinary:
replicas: 1
persistence:
enabled: true
size: 10Gi
storageClass: cfsauto
monitoring:
lokiCanary:
enabled: false
selfMonitoring:
grafanaAgent:
installOperator: false
test:
enabled: false
gateway:
ingress:
enabled: true
ingressClassName: nginx
tls: []
hosts:
- host: loki.k8s.local
paths:
- path: /
pathType: Prefix
|
然后直接使用下面的命令一键部署 Loki 即可:
1
2
3
4
5
6
7
8
| $ helm upgrade --install loki grafana/loki -f loki-values.yaml --namespace kube-otel
$ kubectl get pods -n kube-otel -l app.kubernetes.io/instance=loki
NAME READY STATUS RESTARTS AGE
loki-0 1/1 Running 0 3m52s
loki-gateway-5ffc9fbbf5-m5q75 1/1 Running 0 8m42s
$ kubectl get ingress -n kube-otel
NAME CLASS HOSTS ADDRESS PORTS AGE
loki-gateway nginx loki.k8s.local 10.98.12.94 80 11m
|
启用 filelog 接收器
接下来我们就需要配置 OpenTelemetry Collector 来将日志数据发送到 Loki 中,首先更新 otel-collector-ds-values.yaml 文件,我们需要添加一个 Loki 的导出器,并开启 filelogreceiver 接收器:
1
2
3
4
5
6
7
8
9
10
11
12
13
14
15
16
17
18
19
20
21
22
23
24
25
26
27
28
29
30
31
32
33
34
35
36
37
38
39
40
41
42
43
44
45
46
|
mode: daemonset
presets:
hostMetrics:
enabled: true
kubernetesAttributes:
enabled: true
kubeletMetrics:
enabled: true
logsCollection:
enabled: true
config:
exporters:
loki:
endpoint: http://loki-gateway/loki/api/v1/push
timeout: 10s
read_buffer_size: 200
write_buffer_size: 100
retry_on_failure:
enabled: true
initial_interval: 10s
max_interval: 60s
max_elapsed_time: 10m
default_labels_enabled:
exporter: false
processors:
resource:
attributes:
- action: insert
key: loki.resource.labels
value: k8s.namespace.name,k8s.pod.name,k8s.container.name
service:
pipelines:
logs:
exporters:
- loki
processors:
- memory_limiter
- k8sattributes
- resource
- batch
|
然后重新更新 OpenTelemetry Collector DaemonSet:
1
| helm upgrade --install opentelemetry-collector ./opentelemetry-collector -f otel-ds-values.yaml --namespace kube-otel --create-namespace
|
同样更新后查看完整的配置信息,使用命令 kubectl get cm -n opentelemetry-collector-agent -oyaml:
1
2
3
4
5
6
7
8
9
10
11
12
13
14
15
16
17
18
19
20
21
22
23
24
25
26
27
28
29
30
31
32
33
34
35
36
37
38
39
40
41
42
43
44
45
46
47
48
49
50
51
52
53
54
55
56
57
58
59
60
61
62
63
64
65
66
67
68
69
70
71
72
73
74
75
76
77
78
79
80
81
82
83
84
85
86
87
88
89
90
91
92
93
94
95
96
97
98
99
100
101
102
103
104
105
106
107
108
109
110
111
112
113
114
115
116
117
118
119
120
121
122
123
124
125
126
127
128
129
130
131
132
133
134
135
136
137
138
139
140
141
142
143
144
145
146
147
148
149
150
151
152
153
154
155
156
157
| exporters:
logging:
loglevel: debug
loki:
endpoint: http://loki-gateway/loki/api/v1/push
timeout: 10s
read_buffer_size: 200
write_buffer_size: 100
retry_on_failure:
enabled: true
initial_interval: 10s
max_interval: 60s
max_elapsed_time: 10m
default_labels_enabled:
exporter: false
extensions:
health_check: {}
memory_ballast:
size_in_percentage: 40
processors:
batch: {}
k8sattributes:
extract:
metadata:
- k8s.namespace.name
- k8s.deployment.name
- k8s.statefulset.name
- k8s.daemonset.name
- k8s.cronjob.name
- k8s.job.name
- k8s.node.name
- k8s.pod.name
- k8s.pod.uid
- k8s.pod.start_time
filter:
node_from_env_var: K8S_NODE_NAME
passthrough: false
pod_association:
- sources:
- from: resource_attribute
name: k8s.pod.ip
- sources:
- from: resource_attribute
name: k8s.pod.uid
- sources:
- from: connection
memory_limiter:
check_interval: 5s
limit_percentage: 80
spike_limit_percentage: 25
resource:
attributes:
- action: insert
key: loki.resource.labels
value: k8s.namespace.name,k8s.pod.name,k8s.container.name
receivers:
filelog:
exclude:
- /var/log/pods/kube-otel_opentelemetry-collector*_*/opentelemetry-collector/*.log
include:
- /var/log/pods/*/*/*.log
include_file_name: false
include_file_path: true
operators:
- id: get-format
routes:
- expr: body matches "^\\{"
output: parser-docker
- expr: body matches "^[^ Z]+ "
output: parser-crio
- expr: body matches "^[^ Z]+Z"
output: parser-containerd
type: router
- id: parser-crio
regex: ^(?P<time>[^ Z]+) (?P<stream>stdout|stderr) (?P<logtag>[^ ]*) ?(?P<log>.*)$
timestamp:
layout: 2006-01-02T15:04:05.999999999Z07:00
layout_type: gotime
parse_from: attributes.time
type: regex_parser
- combine_field: attributes.log
combine_with: ""
id: crio-recombine
is_last_entry: attributes.logtag == 'F'
max_log_size: 102400
output: extract_metadata_from_filepath
source_identifier: attributes["log.file.path"]
type: recombine
- id: parser-containerd
regex: ^(?P<time>[^ ^Z]+Z) (?P<stream>stdout|stderr) (?P<logtag>[^ ]*) ?(?P<log>.*)$
timestamp:
layout: "%Y-%m-%dT%H:%M:%S.%LZ"
parse_from: attributes.time
type: regex_parser
- combine_field: attributes.log
combine_with: ""
id: containerd-recombine
is_last_entry: attributes.logtag == 'F'
max_log_size: 102400
output: extract_metadata_from_filepath
source_identifier: attributes["log.file.path"]
type: recombine
- id: parser-docker
output: extract_metadata_from_filepath
timestamp:
layout: "%Y-%m-%dT%H:%M:%S.%LZ"
parse_from: attributes.time
type: json_parser
- id: extract_metadata_from_filepath
parse_from: attributes["log.file.path"]
regex: ^.*\/(?P<namespace>[^_]+)_(?P<pod_name>[^_]+)_(?P<uid>[a-f0-9\-]+)\/(?P<container_name>[^\._]+)\/(?P<restart_count>\d+)\.log$
type: regex_parser
- from: attributes.stream
to: attributes["log.iostream"]
type: move
- from: attributes.container_name
to: resource["k8s.container.name"]
type: move
- from: attributes.namespace
to: resource["k8s.namespace.name"]
type: move
- from: attributes.pod_name
to: resource["k8s.pod.name"]
type: move
- from: attributes.restart_count
to: resource["k8s.container.restart_count"]
type: move
- from: attributes.uid
to: resource["k8s.pod.uid"]
type: move
- from: attributes.log
to: body
type: move
start_at: beginning
otlp:
protocols:
grpc:
endpoint: ${env:MY_POD_IP}:4317
http:
endpoint: ${env:MY_POD_IP}:4318
service:
extensions:
- health_check
- memory_ballast
pipelines:
logs:
exporters:
- loki
processors:
- memory_limiter
- k8sattributes
- resource
- batch
receivers:
- otlp
- filelog
|
我们新增加了一个 loki 的导出器以及 filelog 接收器。
loki 导出器
该导出器是通过 HTTP 将数据导出到 Loki。该导出器可以做以下一些配置:
endpoint:Loki 的 HTTP 端点地址(如 http://loki:3100/loki/api/v1/push)。default_labels_enabled(可选):允许禁用默认标签的映射:exporter、job、instance、level。如果省略default_labels_enabled,则会添加默认标签。如果在 default_labels_enabled 中省略了其中一个标签,则会添加该标签。
如果禁用了所有默认标签,并且没有添加其他标签,则日志条目将被丢弃,因为至少需要存在一个标签才能成功将日志记录写入 Loki 中。指标 otelcol_lokiexporter_send_failed_due_to_missing_labels 将会显示由于未指定标签而被丢弃的日志记录数量。
Loki 导出器可以将 OTLP 资源和日志属性转换为 Loki 标签,并对其进行索引。为此,需要配置提示,指定应将哪些属性设置为标签。提示本身就是属性,在导出到 Loki 时将被忽略。以下示例使用 attributes 处理器提示 Loki 导出器将 event.domain 属性设置为标签,并使用 resource 处理器提示 Loki 导出器将 service.name 设置为标签。
1
2
3
4
5
6
7
8
9
10
11
12
| processors:
attributes:
actions:
- action: insert
key: loki.attribute.labels
value: event.domain
resource:
attributes:
- action: insert
key: loki.resource.labels
value: service.name
|
除非通过 default_labels_enabled 设置禁用,默认标签始终会被设置。
job=service.namespace/service.nameinstance=service.instance.idexporter=OTLPlevel=severity
如果 service.name 和 service.namespace 存在,那么设置 job=service.namespace/service.name。如果 service.name 存在且 service.namespace 不存在,则会设置 job=service.name。如果 service.name 不存在且 service.namespace 存在,则不会设置 job 标签。如果存在 service.instance.id 则设置 instance=service.instance.id。如果 service.instance.id 不存在,则不设置 instance 标签。
我们这里的完整配置如下:
1
2
3
4
5
6
7
8
9
10
| loki:
endpoint: http://loki-gateway/loki/api/v1/push
timeout: 10s
read_buffer_size: 200
write_buffer_size: 100
retry_on_failure:
enabled: true
initial_interval: 10s
max_interval: 60s
max_elapsed_time: 10m
|
我们这里配置了超时时间,读写缓冲区大小,发送队列,重试等。
read_buffer_size 和 write_buffer_size 字段分别指定了 OpenTelemetry 导出器的读取和写入缓冲区的大小。这些缓冲区用于在发送数据之前缓存数据,以提高发送效率和可靠性。
read_buffer_size 字段指定了导出器从数据源读取数据时使用的缓冲区大小。如果数据源产生的数据量超过了缓冲区的大小,导出器将分批读取数据并将其缓存到缓冲区中,直到缓冲区被填满或数据源没有更多数据为止。
write_buffer_size 字段指定了导出器将指标数据写入目标时使用的缓冲区大小。如果导出器产生的数据量超过了缓冲区的大小,导出器将分批将数据写入目标,并将其缓存到缓冲区中,直到缓冲区被填满或目标不可用为止。
通过配置这些缓冲区的大小,您可以控制 OpenTelemetry 导出器的性能和可靠性。如果您的数据源产生的数据量很大,可以增加 read_buffer_size 和 write_buffer_size 的大小,以提高导出器的吞吐量和效率。如果您的目标不太稳定或网络不太可靠,可以减小 write_buffer_size 的大小,以减少数据丢失的风险。
另外添加了一个resource的处理器,将 k8s.namespace.name、k8s.pod.name、k8s.container.name 转换为 Loki 标签,这样我们就可以在 Loki 中对其进行索引了。
1
2
3
4
5
| resource:
attributes:
- action: insert
key: loki.resource.labels
value: k8s.namespace.name,k8s.pod.name,k8s.container.name
|
filelog 接收器
该接收器用于从文件中收集并解析日志数据,它会从指定的文件中读取日志数据,然后将其发送到 OpenTelemetry Collector 中。
我们这里对该接收器的配置如下所示:
1
2
3
4
5
6
7
8
9
10
11
12
13
14
15
16
17
18
19
20
21
22
23
24
25
26
27
28
29
30
31
32
33
34
35
36
37
38
39
40
41
42
43
44
45
46
47
48
49
50
51
52
53
54
55
56
57
58
59
60
61
62
63
64
65
66
67
68
69
70
71
72
73
74
75
76
77
78
| filelog:
exclude:
- /var/log/pods/kube-otel_opentelemetry-collector*_*/opentelemetry-collector/*.log
include:
- /var/log/pods/*/*/*.log
include_file_name: false
include_file_path: true
operators:
- id: get-format
routes:
- expr: body matches "^\\{"
output: parser-docker
- expr: body matches "^[^ Z]+ "
output: parser-crio
- expr: body matches "^[^ Z]+Z"
output: parser-containerd
type: router
- id: parser-crio
regex: ^(?P<time>[^ Z]+) (?P<stream>stdout|stderr) (?P<logtag>[^ ]*) ?(?P<log>.*)$
timestamp:
layout: 2006-01-02T15:04:05.999999999Z07:00
layout_type: gotime
parse_from: attributes.time
type: regex_parser
- combine_field: attributes.log
combine_with: ""
id: crio-recombine
is_last_entry: attributes.logtag == 'F'
max_log_size: 102400
output: extract_metadata_from_filepath
source_identifier: attributes["log.file.path"]
type: recombine
- id: parser-containerd
regex: ^(?P<time>[^ ^Z]+Z) (?P<stream>stdout|stderr) (?P<logtag>[^ ]*) ?(?P<log>.*)$
timestamp:
layout: "%Y-%m-%dT%H:%M:%S.%LZ"
parse_from: attributes.time
type: regex_parser
- combine_field: attributes.log
combine_with: ""
id: containerd-recombine
is_last_entry: attributes.logtag == 'F'
max_log_size: 102400
output: extract_metadata_from_filepath
source_identifier: attributes["log.file.path"]
type: recombine
- id: parser-docker
output: extract_metadata_from_filepath
timestamp:
layout: "%Y-%m-%dT%H:%M:%S.%LZ"
parse_from: attributes.time
type: json_parser
- id: extract_metadata_from_filepath
parse_from: attributes["log.file.path"]
regex: ^.*\/(?P<namespace>[^_]+)_(?P<pod_name>[^_]+)_(?P<uid>[a-f0-9\-]+)\/(?P<container_name>[^\._]+)\/(?P<restart_count>\d+)\.log$
type: regex_parser
- from: attributes.stream
to: attributes["log.iostream"]
type: move
- from: attributes.container_name
to: resource["k8s.container.name"]
type: move
- from: attributes.namespace
to: resource["k8s.namespace.name"]
type: move
- from: attributes.pod_name
to: resource["k8s.pod.name"]
type: move
- from: attributes.restart_count
to: resource["k8s.container.restart_count"]
type: move
- from: attributes.uid
to: resource["k8s.pod.uid"]
type: move
- from: attributes.log
to: body
type: move
start_at: beginning
|
可以看到配置非常长,首先通过 exclude 排除一些不需要收集的日志文件,然后通过 include 指定了需要收集的日志文件,由于我们的 Kubernetes 集群是基于 Containerd 容器运行时的,所以采集的日志目录为 /var/log/pods/*/*/*.log,然后通过 include_file_path 来指定是否将文件路径添加为属性 log.file.path,include_file_name 指定是否将文件名添加为属性 log.file.name。
start_at 表示在启动时,从文件的哪个位置开始读取日志。选项有 beginning 或 end,默认为 end。
然后就是最重要的 operators 属性,用来指定如何处理日志文件,运算符是日志处理的最基本单元。每个运算符都完成一个单一的责任,比如从文件中读取行,或者从字段中解析 JSON。然后,这些运算符被链接在一起,形成一个管道,以实现所需的结果。
例如用户可以使用 file_input 操作符从文件中读取日志行。然后,这个操作的结果可以发送到 regex_parser 操作符,根据正则表达式创建字段。最后,这些结果可以发送到 file_output 操作符,将日志写入到磁盘上的文件中。
我们这里首先配置了一个 router 操作符:
1
2
3
4
5
6
7
8
9
| id: get-format
routes:
- expr: body matches "^\\{"
output: parser-docker
- expr: body matches "^[^ Z]+ "
output: parser-crio
- expr: body matches "^[^ Z]+Z"
output: parser-containerd
type: router
|
该操作符允许根据日志内容动态路由日志,我们这里是 Containerd 的容器运行时,产生的日志数据可以匹配 body matches "^[^ Z]+Z",然后将数据路由到 parser-containerd 操作符。
1
2
3
4
5
6
| id: parser-containerd
regex: ^(?P<time>[^ ^Z]+Z) (?P<stream>stdout|stderr) (?P<logtag>[^ ]*) ?(?P<log>.*)$
timestamp:
layout: "%Y-%m-%dT%H:%M:%S.%LZ"
parse_from: attributes.time
type: regex_parser
|
parser-containerd 是一个 regex_parser 操作符,它使用指定的正则表达式来解析前面路由过来的日志数据,然后会将结果存储在 time、stream、logtag、log 等属性中,并格式化 timestamp 时间戳。
接下来再通过 recombine 操作符将连续的日志组合成单个日志。
1
2
3
4
5
6
7
8
| combine_field: attributes.log
combine_with: ""
id: containerd-recombine
is_last_entry: attributes.logtag == 'F'
max_log_size: 102400
output: extract_metadata_from_filepath
source_identifier: attributes["log.file.path"]
type: recombine
|
经过上面处理后进入 extract_metadata_from_filepath 这个操作符,该操作符使用正则表达式从文件路径中提取元数据,然后将其存储在 namespace、pod_name、uid、container_name、restart_count 等属性中。
1
2
3
4
| id: extract_metadata_from_filepath
parse_from: attributes["log.file.path"]
regex: ^.*\/(?P<namespace>[^_]+)_(?P<pod_name>[^_]+)_(?P<uid>[a-f0-9\-]+)\/(?P<container_name>[^\._]+)\/(?P<restart_count>\d+)\.log$
type: regex_parser
|
接下来就是通过 move 操作符将一个字段从一个位置移动(或重命名)到另一个位置。
1
2
3
4
5
6
7
8
9
10
11
12
13
14
15
16
17
18
19
20
21
| - from: attributes.stream
to: attributes["log.iostream"]
type: move
- from: attributes.container_name
to: resource["k8s.container.name"]
type: move
- from: attributes.namespace
to: resource["k8s.namespace.name"]
type: move
- from: attributes.pod_name
to: resource["k8s.pod.name"]
type: move
- from: attributes.restart_count
to: resource["k8s.container.restart_count"]
type: move
- from: attributes.uid
to: resource["k8s.pod.uid"]
type: move
- from: attributes.log
to: body
type: move
|
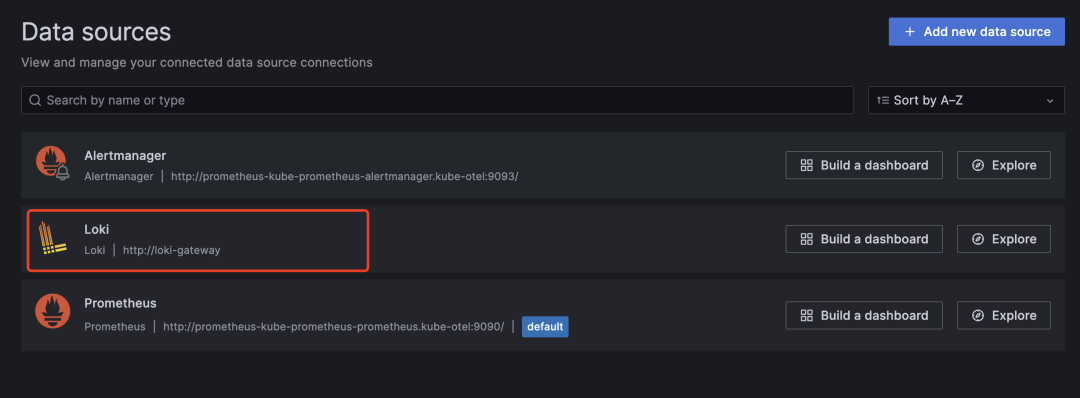
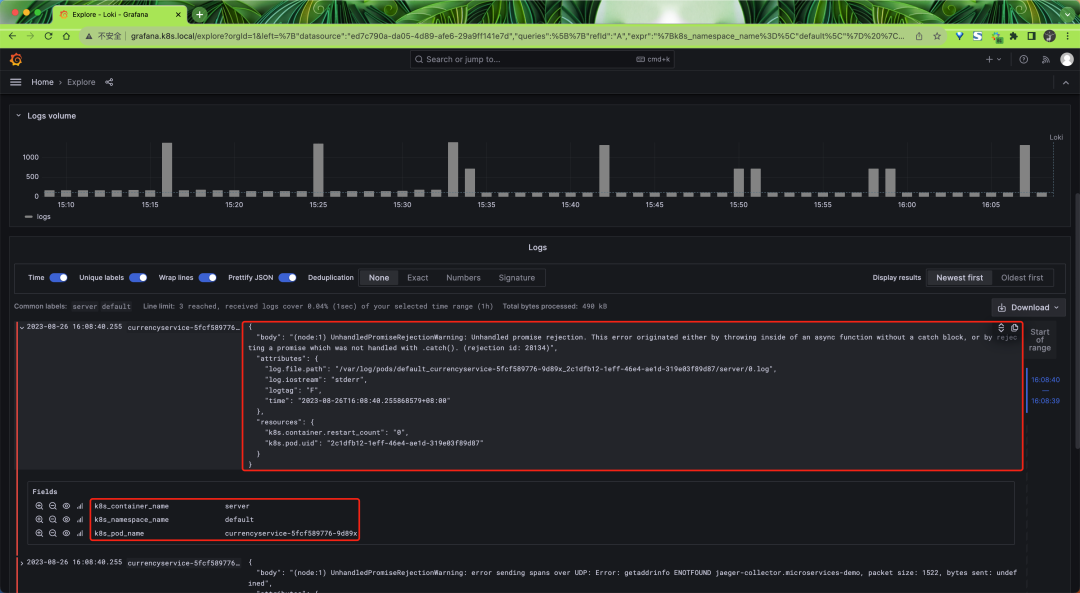
最后我们可以将 Loki 数据源添加到 Grafana 中:
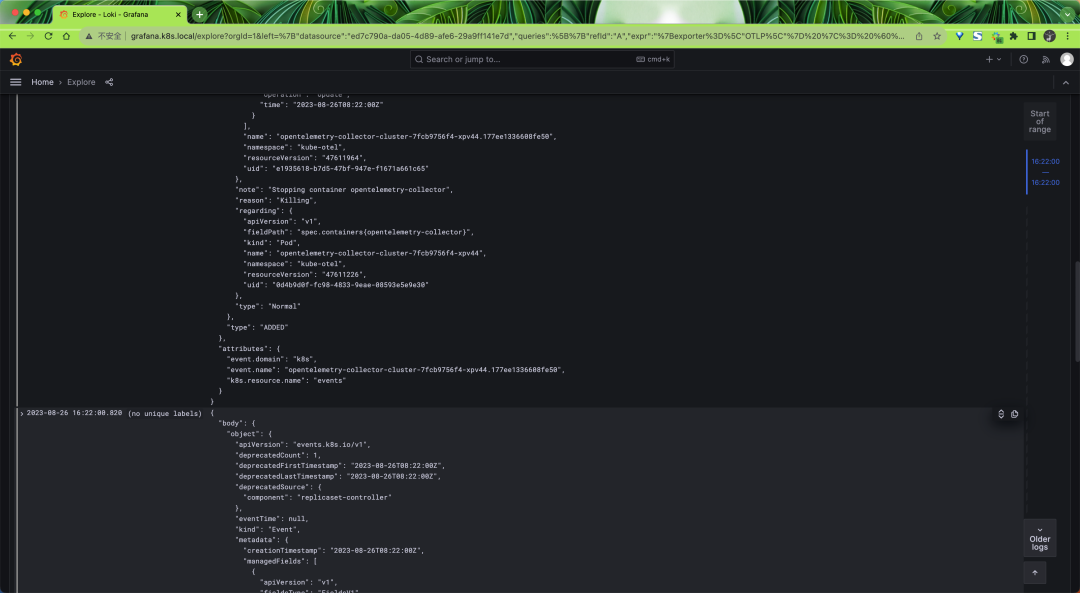
然后在 Explorer 页面切换到 Loki 数据源下面就可以看到 Loki 中的日志数据了:
启用 k8sobject 接收器
同样对于 Gateway 模式的采集器我们还可以去开启 k8sobject 接收器来采集 Kubernetes Events 数据,然后更新 otel-collector-deploy-values.yaml 文件:
1
2
3
4
5
6
7
8
9
10
11
12
13
14
15
16
17
18
19
20
21
22
23
24
25
26
27
28
29
30
|
mode: deployment
replicaCount: 1
presets:
clusterMetrics:
enabled: true
kubernetesEvents:
enabled: true
config:
exporters:
loki:
endpoint: http://loki-gateway/loki/api/v1/push
timeout: 10s
read_buffer_size: 200
write_buffer_size: 100
retry_on_failure:
enabled: true
initial_interval: 10s
max_interval: 60s
max_elapsed_time: 10m
service:
pipelines:
logs:
exporters:
- loki
|
然后重新更新 OpenTelemetry Collector Deployment:
1
| helm upgrade --install opentelemetry-collector-cluster ./opentelemetry-collector -f otel-collector-deploy-values.yaml --namespace kube-otel --create-namespace
|
这里我们开启了 kubernetesEvents 预设,对应的配置如下所示:
1
2
3
4
5
| k8sobjects:
objects:
- group: events.k8s.io
mode: watch
name: events
|
k8sobjects 接收器可以用来拉取或 Watch Kubernetes API 服务器中的对象,我们这里通过 group、mode、name 来指定要拉取的 Kubernetes Events 对象。
最后我们也可以在 Loki 中查找到对应的 Events 日志数据。